© J Renwick Beattie. Data Scientist. Privacy Policy | Terms and Conditions | External Resource Links | Contact Form


Peer-Reviewed Scientific Articles
Below is a list of J Renwick Beattie’s contributions to the scientific literature in the form of peer- reviewed articles.
For publicly available profiles on scientific and professional sites please click the icons immediately below
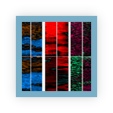
DATA ANALYSIS
CALCIUM
FRACTURE
FRACTURE
2021
2020
2018
2018
2019

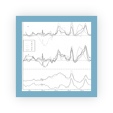
SIGNAL PROCESSING
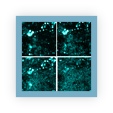
RETINA
SIGNAL PROCESSING
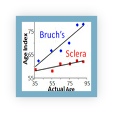
PROTEIN AGING
PROTEIN AGING
2013
2012
2010
2011
2011

ONCOLOGY
FATS
SIGNAL PROCESSING
PROTEIN AGING
MEAT QUALITY
2010
2009
2008
2008
2009
PROTEIN AGING
RETINA
FATS
PROTEIN AGING
PHARMACEUTICALS
2008
2007
2007
2007
2007
FATS
FATS
ONCOLOGY
RETINA
MEAT QUALITY
2007
2006
2004
2005
2006
FATS
FATS
PHARMACEUTICAL
FATS
FATS
2004
2004
2002
2003
2004


FRACTURE

DATA ANALYSIS
2021

FRACTURE
FRACTURE
FATS
SIGNAL PROCESSING
PROTEIN AGING
2017
2016
2013
2014
2015